How do you measure ROI in higher education marketing?
By Morgan Northmore, Copywriter and Digital Marketing Coordinator at Noetic Marketer. Morgan works with higher education institutions across Canada to develop performance-driven marketing strategies, focusing on building measurable enrolment pipelines and reporting frameworks that connect digital marketing activity to real enrolment outcomes.
Key takeaways:
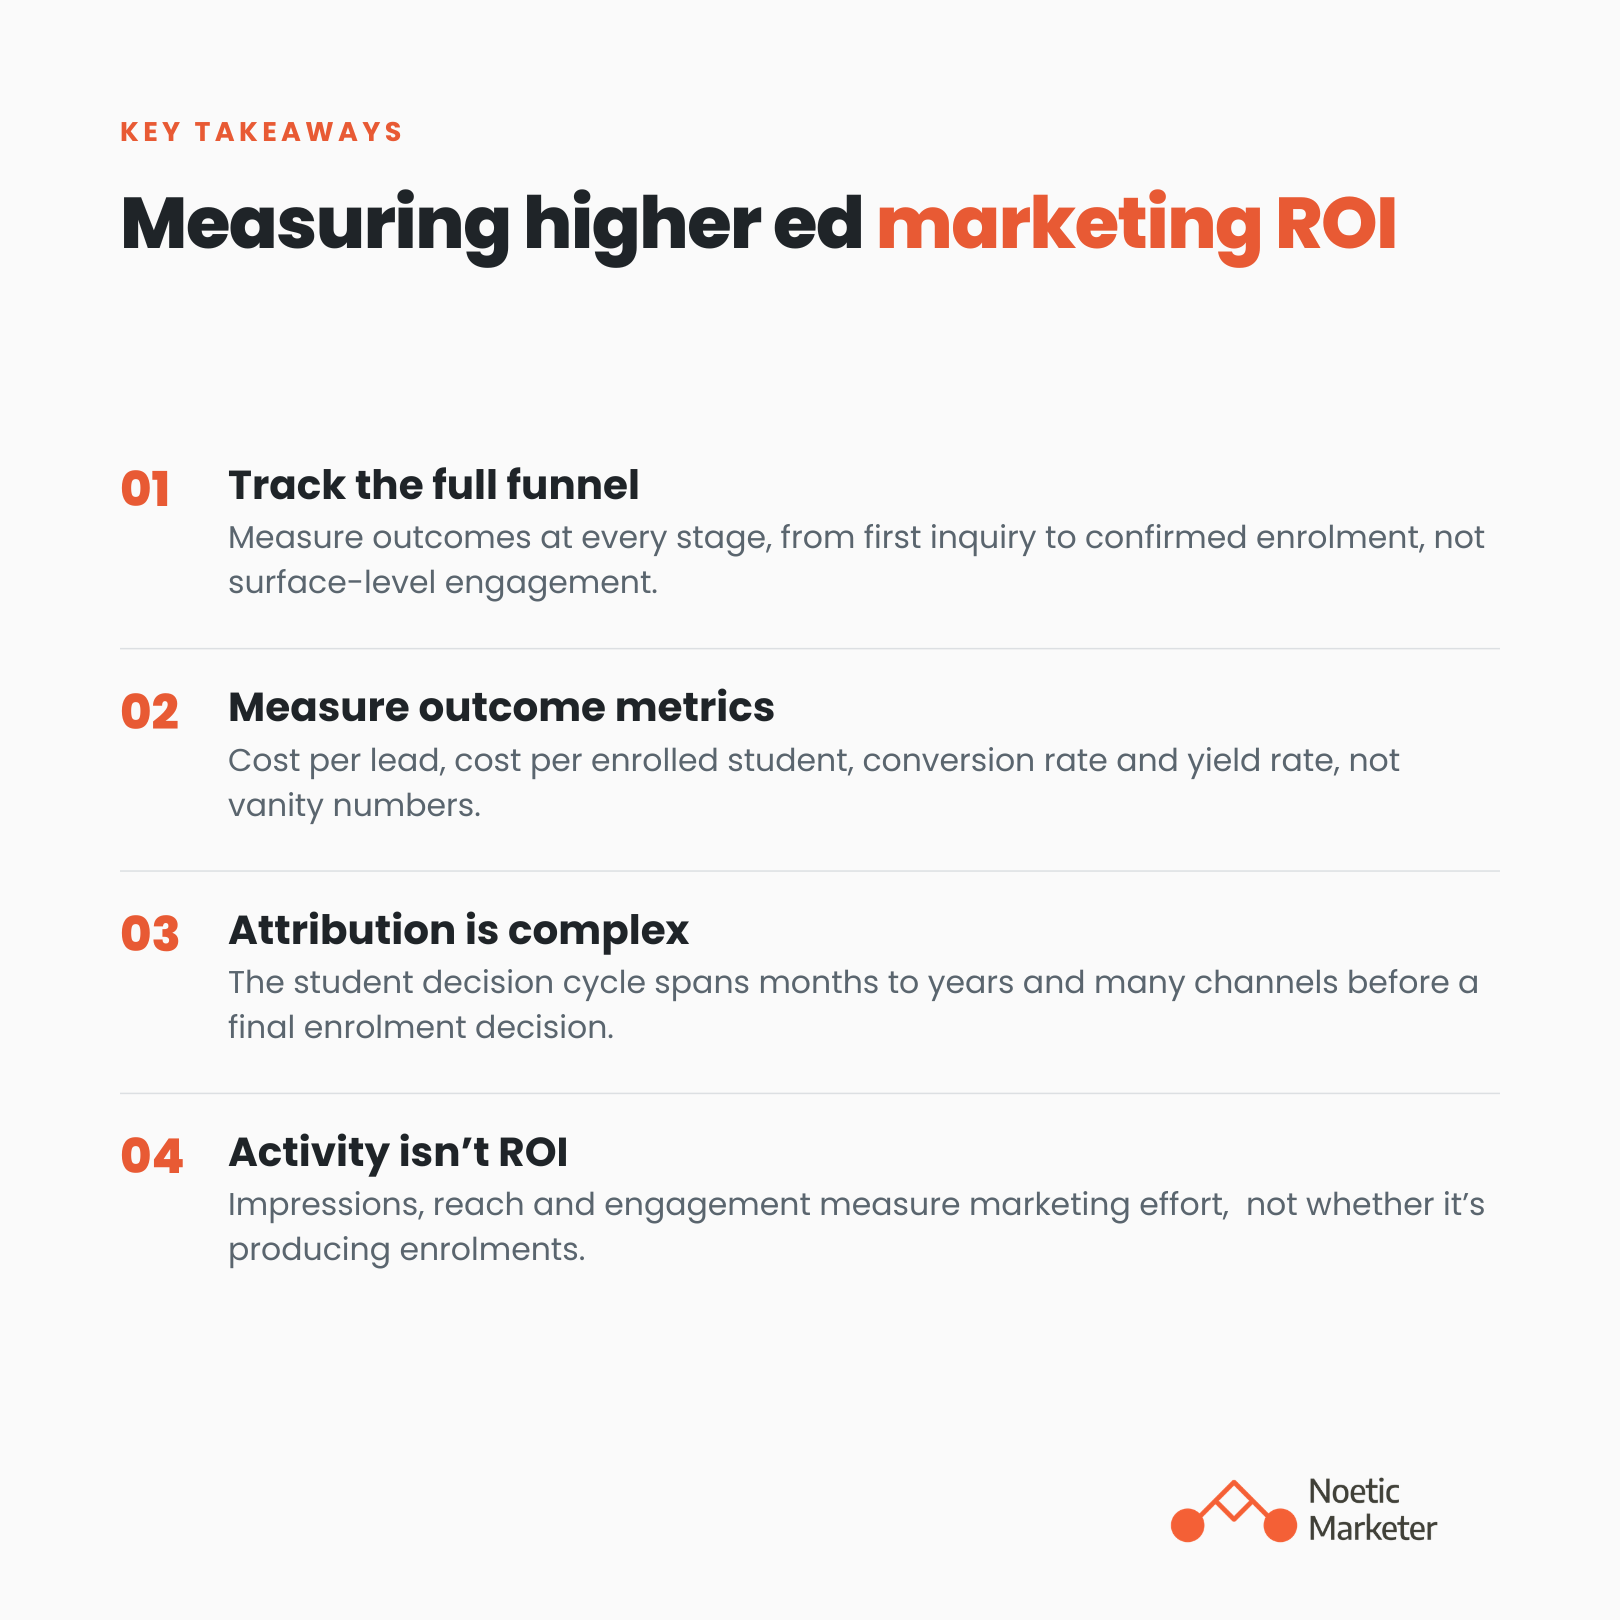
Full-funnel tracking: Measuring return on investment in higher education marketing requires tracking outcomes at each stage of the enrolment funnel, from first inquiry through to enrolment, rather than measuring only surface-level engagement metrics.
Core metrics: Cost per lead, cost per enrolled student, conversion rate, and yield rate are enrolment-specific marketing investment performance metrics you want to track.
Complex attribution: Attribution in higher education is more complex than in most industries because the student decision cycle spans months to years and involves multiple channels and touchpoints before a final enrolment decision is made.
Meaningful measurement: Institutions that measure only vanity metrics such as impressions, reach, or social media engagement are not measuring marketing ROI. They are measuring marketing activity.
Measuring marketing ROI in higher education is no longer just a reporting exercise. As more enrolment marketing dollars shift toward digital channels, institutions are under growing pressure to prove which campaigns, platforms, and touchpoints are actually contributing to student enrolment.
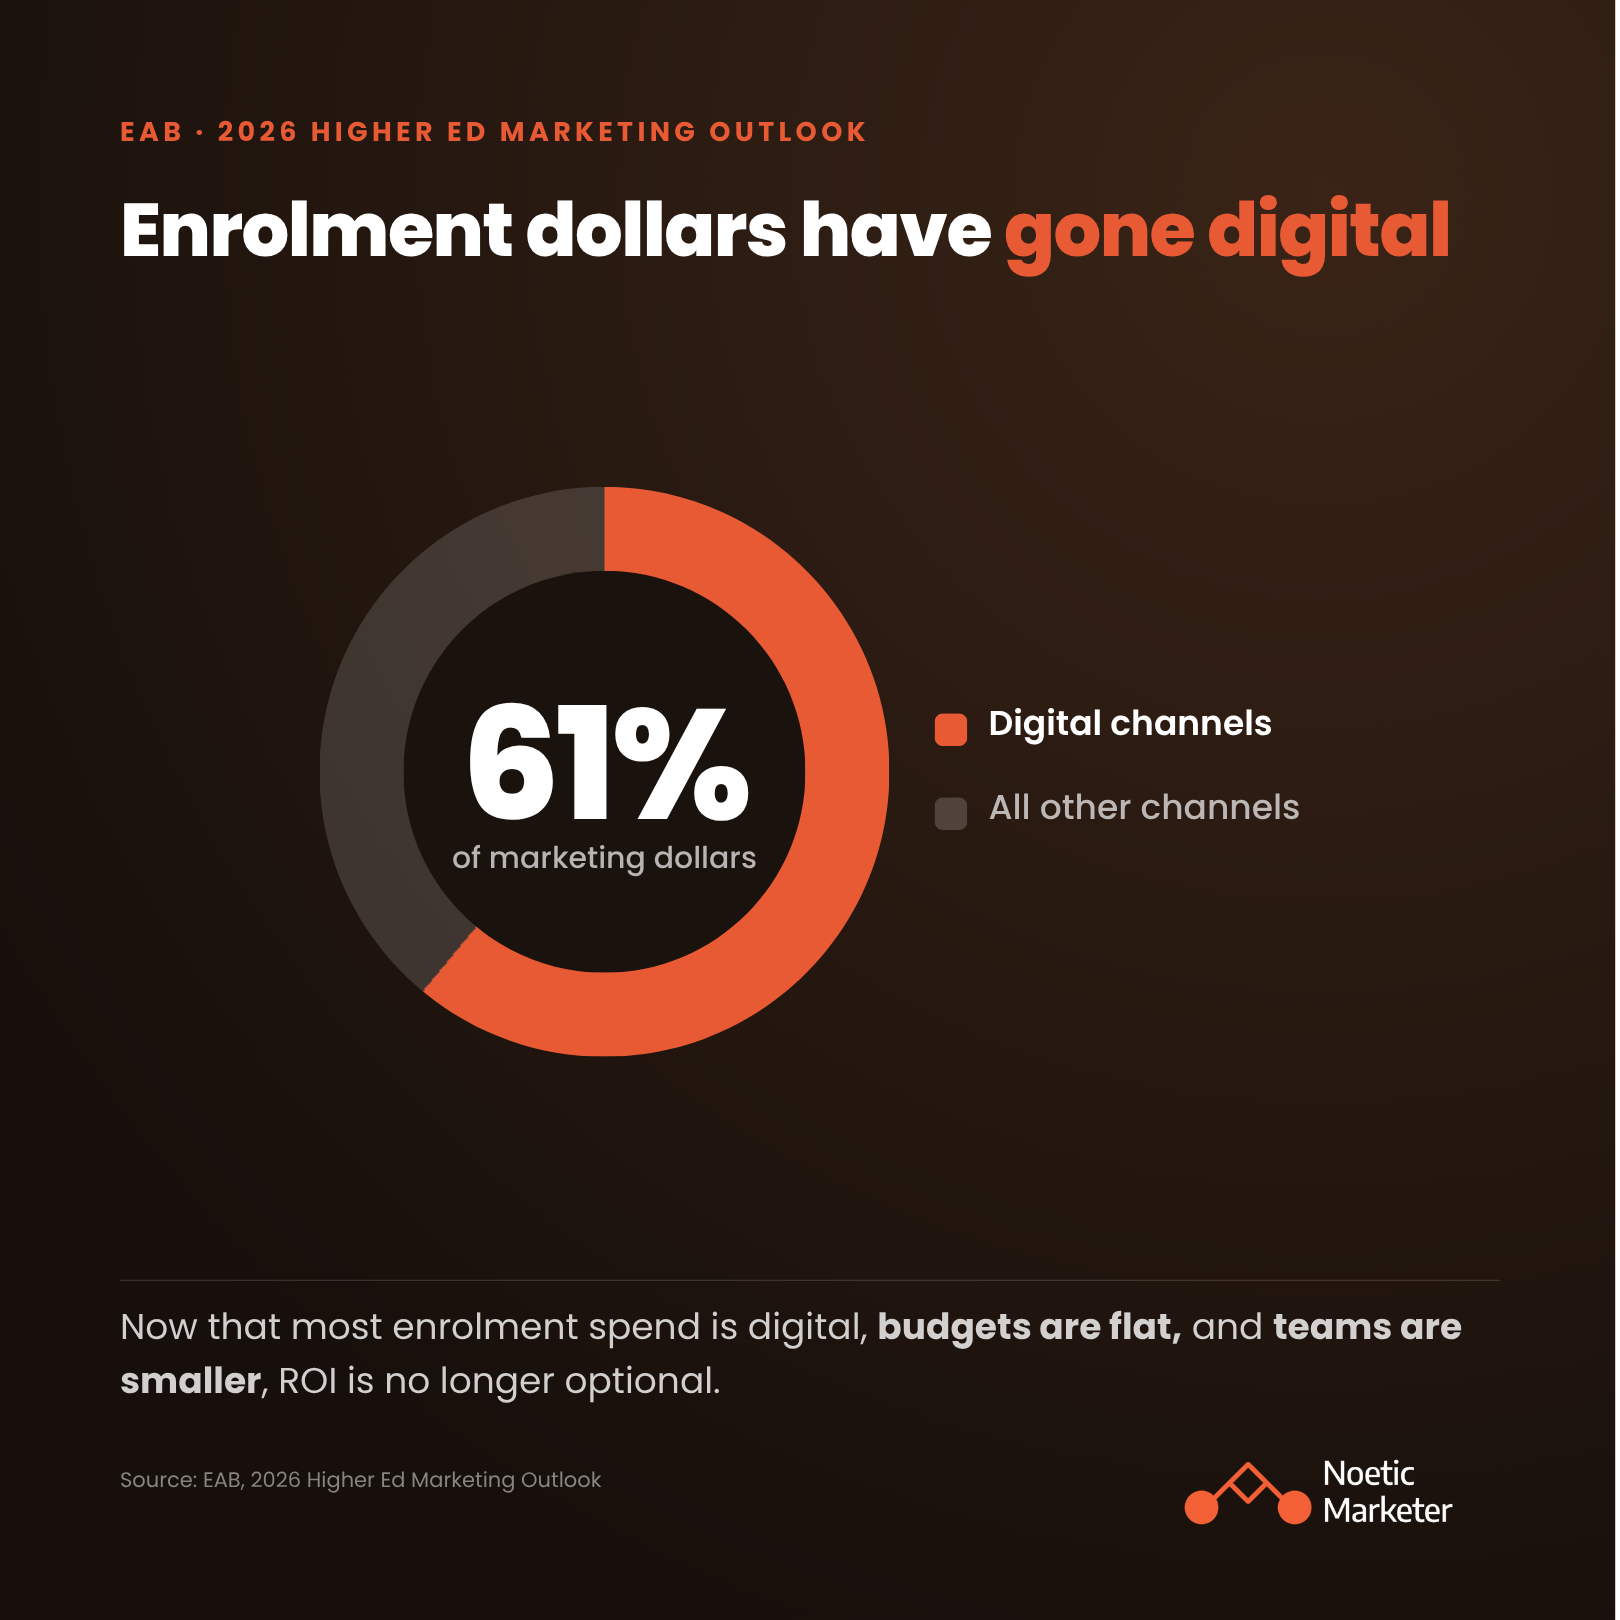
According to EAB’s 2026 Higher Ed Marketing Outlook, 61% of enrolment marketing dollars now support digital efforts, even as marketing leaders face flat budgets, smaller teams, and increased pressure to deliver measurable enrolment results. That makes surface-level metrics like clicks, impressions, and reach insufficient on their own. To understand true ROI, institutions need to connect marketing investment to outcomes across the full enrolment funnel, from inquiries and applications to confirmed students.
What is marketing ROI in higher education?
Marketing ROI in higher education is a measure of the revenue generated from enrolment outcomes relative to the total cost of the marketing activities used to attract and convert the leads.
In a commercial context, return on investment is typically straightforward: revenue minus cost divided by cost. In higher education marketing, the calculation is more nuanced because the return on a marketing investment often involves tuition revenue, student lifetime value, and spending decisions that materialize months after the marketing activity occurred.
A simple formula used by many institutions to calculate marketing ROI is:

In practice, calculating this accurately requires knowing the total tuition and fees revenue attributable to enrolled students from specific marketing channels, as well as the full cost of those channels, including agency fees, platform spend, and internal resources.
Why is measuring ROI in higher education different from other industries?
Measuring ROI in higher education differs from other industries because the student decision cycle is significantly longer, the funnel involves multiple stakeholders, and the path from the first touchpoint to enrolment typically spans several months or even years and dozens of interactions.
A prospective student may encounter a Google ad in September, attend a virtual open house in October, receive an email sequence through the winter, apply in January, and confirm enrolment in April. Attributing that enrolment to a single marketing channel ignores the full picture and leads to misallocation of marketing budget.
This multi-touch reality means that higher education marketers need attribution models that reflect how students actually make decisions, not models designed for industries with short, linear purchase cycles. It also means that measuring marketing ROI in higher education requires a connected data infrastructure in which campaign platforms, CRM systems, and enrolment databases share information.
What metrics should higher education marketers track?
Higher education marketers should prioritize metrics that directly link marketing activity to enrolment outcomes, including cost per lead, application rate, conversion rate, yield rate, and cost per enrolled student.
Tracking only engagement metrics such as impressions, reach, and follower counts tells an institution how much marketing activity is occurring, but not whether that activity is producing enrolment results. The shift from activity metrics to outcome metrics is the foundation of any meaningful ROI framework.

What does cost per lead mean in higher education marketing?
Cost per lead (CPL) in higher education digital advertising is the total amount spent on a campaign divided by the number of qualified inquiries or leads generated during that campaign.
CPL is one of the most commonly used performance metrics because it directly measures how efficiently a campaign is generating actionable student interest. A lower CPL generally indicates stronger targeting, more relevant messaging, or better-performing landing pages, and often a combination of all three.
Over four months, a digital marketing campaign launched and managed by Noetic Marketer for an Alberta-based business school achieved a cost per lead 63% lower than the industry benchmark for graduate programs. That CPL improvement was the result of precise audience targeting on LinkedIn and Meta, paired with landing pages designed specifically for the prospective student persona.
CPL is most useful when benchmarked against a known standard: the institution's own historical performance, an industry average, or a program-specific baseline.
What does cost per enrolled student mean, and why does it matter?
Cost per enrolled student (also called cost per enrolment, or CPE) is the total marketing spend divided by the number of students who completed enrolment and confirmed their place in a program.
CPE is the most comprehensive single-metric view of marketing ROI in higher education because it ties the marketing budget directly to the outcome that generates tuition revenue. An institution that knows its CPE can calculate marketing ROI using actual enrolment numbers rather than estimated conversion rates.
The challenge with CPE is that it requires attribution systems capable of tracing a confirmed enrolled student back to the marketing touchpoints that preceded their application and enrolment. Without that connection, institutions can calculate CPL but cannot calculate CPE, leaving them to measure marketing efficiency at the lead stage rather than the enrolment stage.
What does yield rate mean, and how does it relate to marketing ROI?
Yield rate is the percentage of admitted students who confirm enrolment, and it relates to marketing ROI because yield is the final stage at which marketing activity can influence a student's decision.A student who has been admitted but has not yet confirmed is still in the marketing funnel. Targeted communications, event invitations, peer connection programs, and campus experience content all influence whether an admitted student chooses to enrol. Institutions that track yield rate by student segment can identify where marketing activity is supporting or failing enrolment conversion at the final stage.
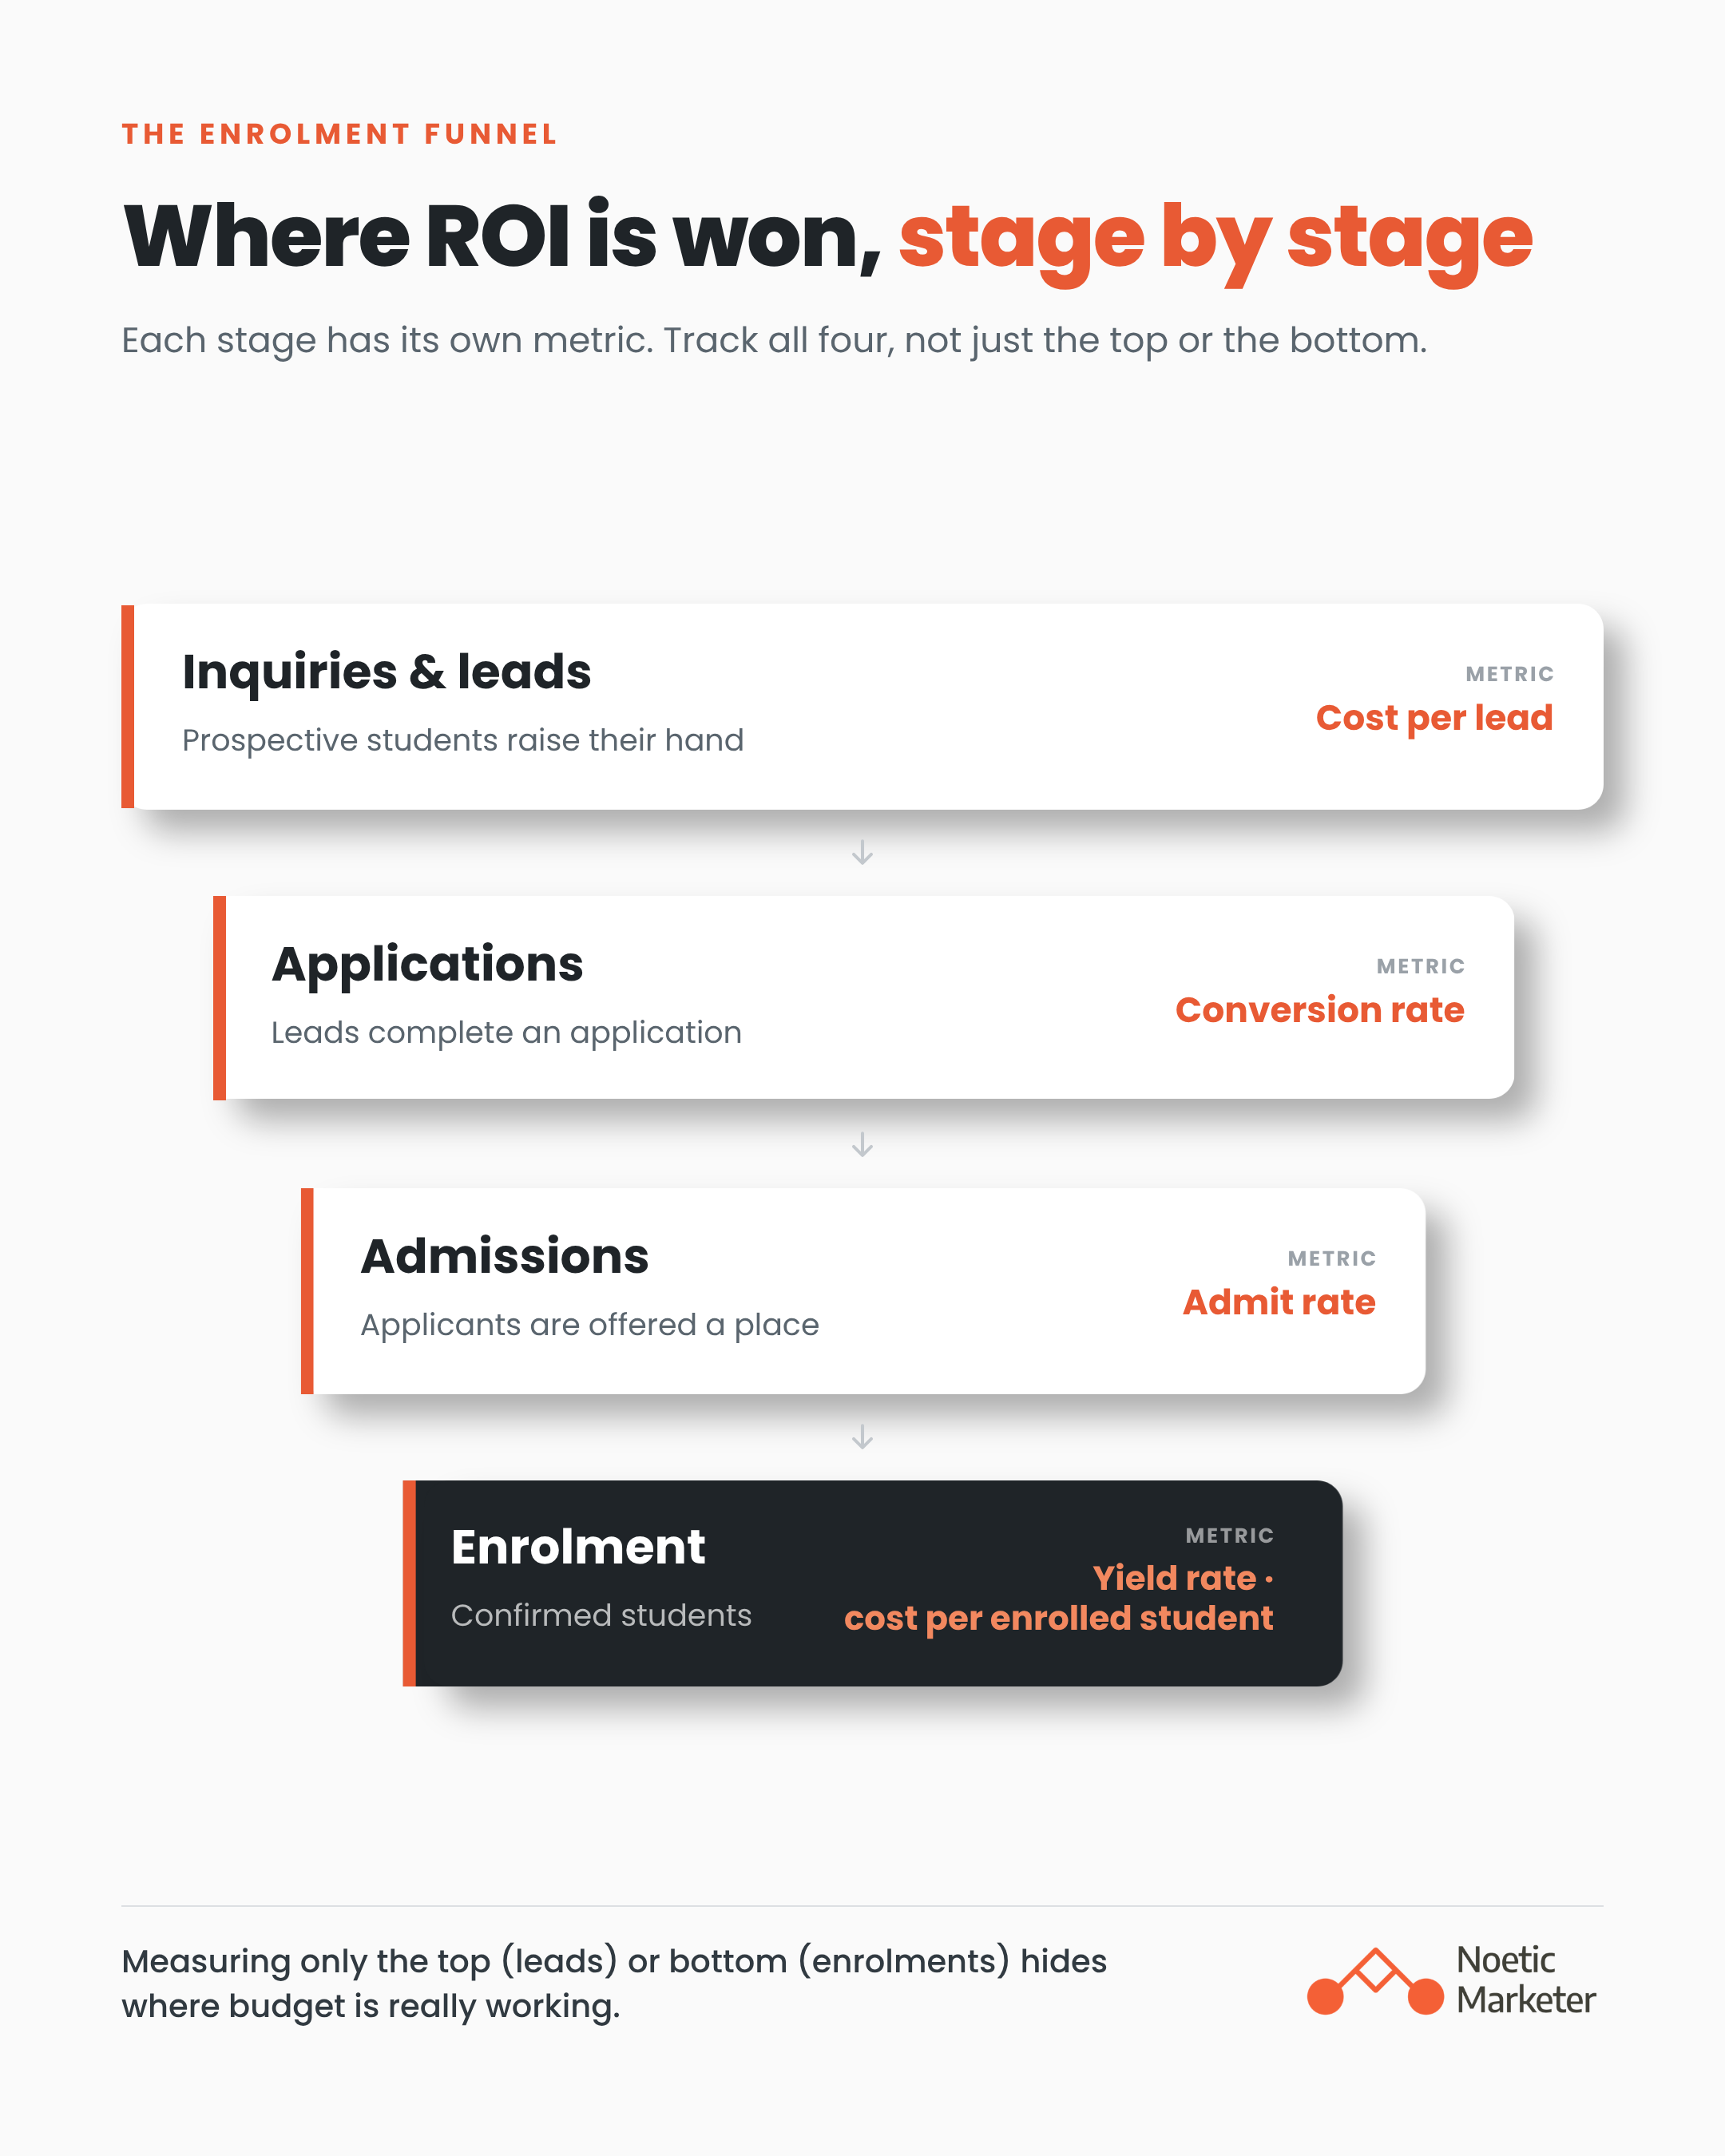
When yield rate is tracked alongside CPL and CPE, an institution has a three-stage view of how its marketing investment is performing: how efficiently it generates leads, how effectively it converts leads to admitted students, and how successfully it confirms enrolments from the admitted pool.
What are vanity metrics and why should higher education marketers avoid them?
Vanity metrics are performance indicators that produce large-sounding numbers but do not directly relate to enrolment outcomes. Common vanity metrics in higher education marketing include total impressions, follower counts, social media likes, and website page views.
These metrics are not without value. A social media post that generates significant reach may be contributing to program awareness among prospective students. But reach alone tells an institution nothing about whether that awareness is translating into inquiries, applications, or enrolments.
Institutions that report primarily on vanity metrics are measuring how much marketing is happening, not whether it is working. A useful diagnostic question for any metric on a marketing dashboard is: does a change in this number give us direct information about enrolment performance? If not, it should sit in a secondary reporting layer rather than at the top of the ROI conversation.

How does attribution work in higher education marketing?
Attribution in higher education marketing is the process of assigning credit for an enrolment outcome to the marketing channels and touchpoints that contributed to a student's decision.
Because the student decision journey involves multiple channels, multiple interactions, and a long timeline, attribution in higher education is rarely straightforward. A student who submits an application may have been influenced by a Google Search ad, three retargeting display ads, two email newsletters, a virtual campus tour, and a phone call from an admissions officer over several months.
What is multi-touch attribution and why is it important?
Multi-touch attribution is a framework that distributes credit for an enrolment outcome across all marketing touchpoints a student interacted with during their decision journey, rather than crediting only the first or last touchpoint.
Last-touch attribution, which credits the final interaction before a student submits an application, is the simplest model but the least accurate. It systematically undercounts the contribution of awareness and consideration-stage channels such as display advertising, social media, and content marketing, which rarely produce the final interaction before an application but often play an important role in earlier stages.
Multi-touch attribution models distribute credit more accurately, allowing marketing teams to see which channels contribute to enrolment outcomes across the full student journey. The most common models include linear attribution (equal credit to all touches), time-decay attribution (more credit to more recent touches), and position-based attribution (more credit to first and last touches).
Choosing the right model for a given institution depends on the length of the enrolment cycle, the number of active marketing channels, and the sophistication of the institution's data infrastructure.
What tools are used to track marketing attribution in higher education?
Marketing attribution in higher education is typically tracked using a combination of Google Analytics (or GA4), CRM platforms, UTM parameters, and enrolment management systems.
Google Analytics tracks how prospective students find and interact with an institution's website, including which campaigns and channels are driving traffic, inquiry form completions, and application starts. UTM parameters appended to campaign URLs allow Google Analytics to distinguish traffic from specific campaigns, channels, and ads, enabling a direct link between a marketing investment and a website action.
CRM platforms hold student records from inquiry through to enrolment and can be connected to campaign data to show how students who came through different marketing channels progressed through the funnel. When CRM data is connected to enrolment management systems, institutions can calculate CPE by channel rather than CPL alone.
For institutions beginning to build a measurement framework, UTM tracking for all paid campaigns is the most practical first step. It requires no additional technology investment and immediately improves the quality of attribution data available in existing analytics tools. Noetic Marketer's analytics and performance reporting services include full UTM architecture setup as part of campaign deployment.
What does a higher education marketing ROI framework look like?
A higher education marketing ROI framework is a structured approach to measuring, reporting, and improving the return on marketing investment across every stage of the student enrolment funnel.
An effective framework connects three levels of reporting:
Channel performance: How is each marketing channel performing at the stage it is designed to influence? Google Ads is measured by cost per click and cost per inquiry. Meta is measured by CPL and video completion rate. LinkedIn is measured by cost per marketing qualified lead (MQL).
Funnel performance: How are leads moving through the funnel from inquiry to application to admission to enrolment? Where are the highest drop-off rates, and what do they suggest about campaign and customer-journey quality or admissions-process friction?
Program-level ROI: What is the CPE for each program? What is the ratio of marketing spend to tuition revenue generated? How does this compare to prior cycles?
Reporting at all three levels gives a marketing team the information needed to optimize within a campaign cycle and to make budget allocation decisions at the start of the next one.
How should higher education marketers report ROI to leadership?
Higher education marketers should report ROI to leadership using enrolment-outcome metrics mapped to specific programs, campaigns, and time periods, with comparisons to prior-year performance or defined benchmarks.
Leadership-level reporting is most effective when it focuses on a small number of key metrics that directly reflect institutional priorities. For most institutions, those metrics are: number of enrolments attributable to digital marketing campaigns, CPE by program, and year-over-year change in CPL.
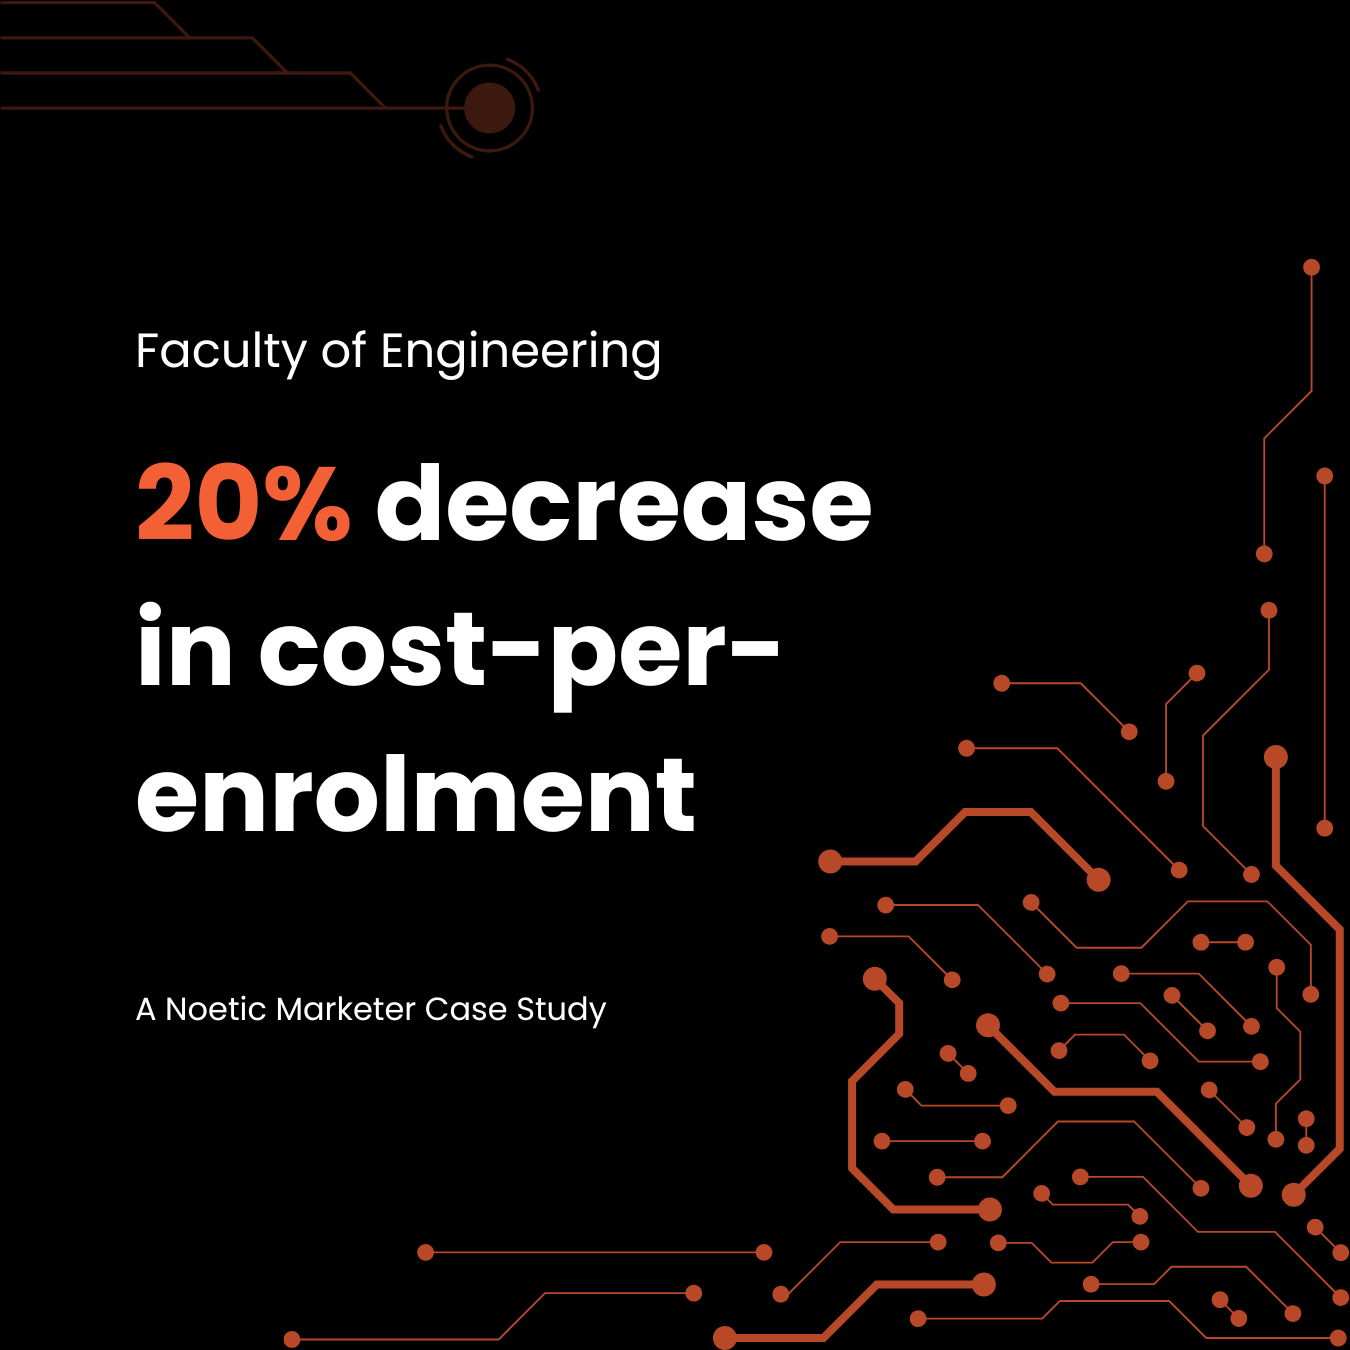
Connecting marketing performance data to enrolment outcomes requires coordination between marketing, admissions, and institutional research. When Noetic Marketer ran a multi-platform campaign for two new programs at a leading Ontario faculty of engineering, the campaign generated 6,000+ marketing-qualified leads in the first year after launching and achieved a combined cost per admission that was 68.94% lower than the Faculty's historical baseline. Reporting at this level requires tracking that begins at the lead-generation stage and continues through to confirmed admission.
How do you improve ROI in higher education marketing?
Marketing ROI in higher education improves when institutions measure the right outcomes, test systematically, and use campaign data to make decisions about creative, targeting, and channel allocation.
The most consistent driver of CPL improvement is landing page optimization. An ad that drives traffic to a generic program page with a complex navigation menu will underperform compared to the same ad driving traffic to a purpose-built page with a single, clear call to action. For Alpha Career College, Noetic Marketer's combination of continuously tested ad creatives, AI-generated lookalike audiences, and program-specific landing pages contributed to a 919% increase in conversion rate and a 30% reduction in cost per lead over the engagement period from 2021 to 2024.
The second driver is audience targeting. As targeting precision improves, marketing spend reaches more qualified prospective students and less of the broader population, reducing CPL and improving the lead-to-application ratio. Detailed persona work at the start of a campaign cycle is the most effective way to improve targeting quality before a campaign launch.
A third driver is measurement itself. Institutions that invest in connecting their marketing analytics to their CRM and enrolment systems gain a more complete view of which activities are actually driving enrolment, and can reallocate budget accordingly. Higher education marketing often involves longer sales cycles and complex student journeys, which make attribution genuinely difficult, but even partial visibility into which channels contribute to enrolment outcomes is significantly more useful than measuring only impressions and clicks.
For a broader view of how paid digital campaigns fit into a full enrolment strategy, our blog How Paid Advertising Drives Student Applications for Universities covers the full-funnel channel approach in detail.
Conclusion
Measuring marketing ROI in higher education requires a commitment to tracking outcomes that matter: cost per lead, cost per enrolled student, conversion rate, and yield. Institutions that measure only marketing activity (reach, impressions, follower counts) are not measuring ROI. They are measuring effort.
The shift from activity-based reporting to outcome-based reporting is not primarily a technology question. It is a strategic choice about what the marketing team is accountable for and how that accountability is communicated to institutional leadership. The institutions that make that shift systematically and build the data infrastructure to support it are best positioned to demonstrate the value of their marketing investment and allocate their next budget cycle more effectively.
For institutions looking to improve their measurement and enrolment performance, Noetic Marketer’s higher education marketing services are built to connect strategy, campaign execution, and reporting to real student outcomes.
Strengthen your higher education marketing strategy
Schedule a meeting with our education marketing experts today for a focused conversation about your enrolment goals and marketing opportunities.
Don’t miss our other posts on digital marketing for education.
How does paid advertising drive student applications for higher education?
How do you choose the best higher education marketing agency?
Why is enrolment marketing essential for higher education institutions in 2026?
How can boarding schools create effective marketing strategies to attract students in 2026?
How do private schools approach marketing?
What does a higher education marketing agency actually do?
What is higher education marketing, and how is it different from traditional marketing?
How Can Universities Create an Effective Higher Education Marketing Budget?
What Are 11 Valuable Strategies for Recruiting International Students?
What Are 9 Proven Strategies for Marketing Higher Education to Adults?
What Makes Student Testimonials Crucial for University Recruitment Marketing?
How Can Universities Use Video Content to Boost Student Recruitment?
What Are 5 Effective Marketing Strategies for Recruiting Undergraduate Students?
How Can Universities Use AI for Marketing?
What Are the 7 Key Challenges in Higher Education Digital Marketing and How Can They Be Solved?
Key marketing terms
Marketing ROI (return on investment): A measure of the revenue generated from enrolled students relative to the total cost of the marketing activities that attracted and converted them. Calculated as revenue minus cost divided by cost.
Cost per lead (CPL): The total amount spent on a campaign divided by the number of qualified inquiries generated. CPL measures how efficiently a marketing campaign converts ad spend into prospective student interest.
Cost per enrolled student (CPE): The total marketing spend divided by the number of students who completed enrolment and confirmed their place in a program. CPE ties the marketing budget directly to the outcome that generates tuition revenue.
Yield rate: The percentage of admitted students who confirm enrolment. Yield rate is the final-stage conversion metric in the enrolment funnel and is influenced by post-admission marketing activity, including targeted communications and campus experience content.
Conversion rate: The percentage of prospective students who complete a desired action, such as submitting an inquiry form or starting an application. In higher education, conversion rate is measured at multiple stages of the funnel: from visit to inquiry, from inquiry to application, and from application to enrolment.
Attribution: The process of assigning credit for an enrolment outcome to the marketing channels and touchpoints that contributed to a student's decision. Attribution in higher education is complex because the student decision cycle spans months and involves multiple channels.
Multi-touch attribution: An attribution model that distributes credit for an enrolment outcome across all of the marketing touchpoints a student interacted with during their decision journey, rather than crediting only the first or last interaction.
Marketing qualified lead (MQL): A prospective student who meets the institution's defined criteria for academic fit, geographic region, or program intent and has demonstrated meaningful interest through actions such as submitting an inquiry form or registering for an event.
Vanity metrics: Performance indicators that produce large numbers but do not directly relate to enrolment outcomes. Common vanity metrics in higher education include total impressions, social media follower counts, and page views without conversion tracking.
UTM parameters: Tags appended to campaign URLs that allow analytics platforms to identify which campaign, channel, or ad drove a specific visit or conversion. UTM parameters are the foundation of campaign attribution and are required for accurate channel-level CPL reporting.
Student lifetime value (CLTV): The total anticipated tuition and fee revenue a student will generate over the course of their enrolment. CLTV can be used to contextualize CPE: a higher CPE may still represent strong ROI if the programs being marketed have long enrolment periods or high tuition.
Enrolment funnel: The full sequence of stages a prospective student moves through from first awareness of a program to confirmed enrolment. Marketing ROI in higher education is measured across this entire funnel, not only at the top or bottom.